
Back in August 2017, I had the fortune to try out the Amphenol Air Quality Engineering Development Kit. This was an offer made by Element14 to road test the product. It was an aptly timed offer as I was, at the time, investigating air quality measurement. The kit consists of several air quality sensors hooked up to an Arduino. Let me tell you about it.
The Amphenol Air Quality Kit
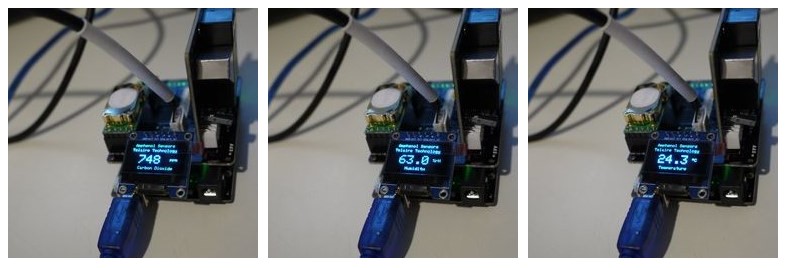
The kit itself comprises an adapter board (shield) for the Arduino with the connections already populated for several sensors. These include CO2, dust, and combined humidity and temperature sensors. Alongside these is a small OLED screen, a complete metrology kit in a box.

The kit even includes a pre-programmed Arduino Uno board. This made the kit pretty much plug and play. That said, some of the connections were a little fiddly. Once connected, it could be powered from a USB outlet and worked straight out of the box.
One of the easiest kits I’ve ever had the pleasure of setting up. No trying to figure out which Arduino software to upload, not battling with settings and no trying to find obscure libraries. Just plug it in and add power. The full unboxing article can be found here;
Element 14 Road Test – Amphenol Air Quality Kit First Impressions
Real-world application of the Amphenol dev kit
Why am I adding this electronics article to an Automotive blog? At the time, I was carrying out some investigation into cabin air quality in a Land Rover. Not just any Land Rover. I was using my own Freelander! This happened to be the perfect mule as the target vehicle was a similar size and cabin design.
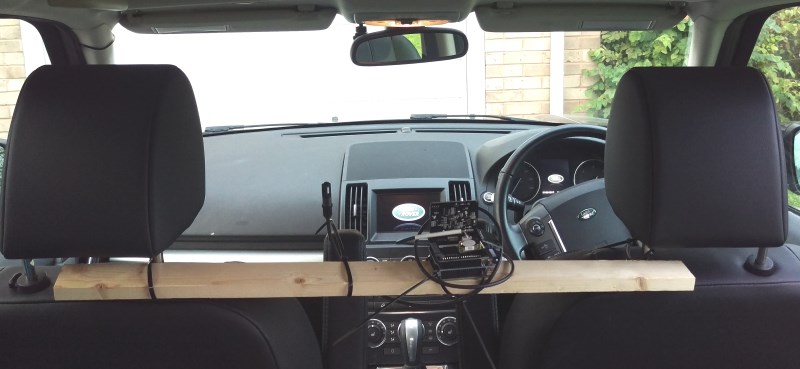
The screen was quickly removed from the development board, and a logging shield added to the Arduino Uno. Then, with a couple of changes to the original Amphenol code, the sensor values were written directly to an SD card. Over the next few weeks, I drove some 600 miles in all kinds of conditions. The resulting data gave an insight into the cabin air quality and what the sensors could tell us.
A typical day’s data
Along with the Amphenol Air Quality Kit sensor data, I also logged some vehicle parameters. I did this using an ELM327 based OBD adapter and the Torque Android App. I’m kind of glad I did this as it gave some interesting insights, most notably relationships to vehicle speed.
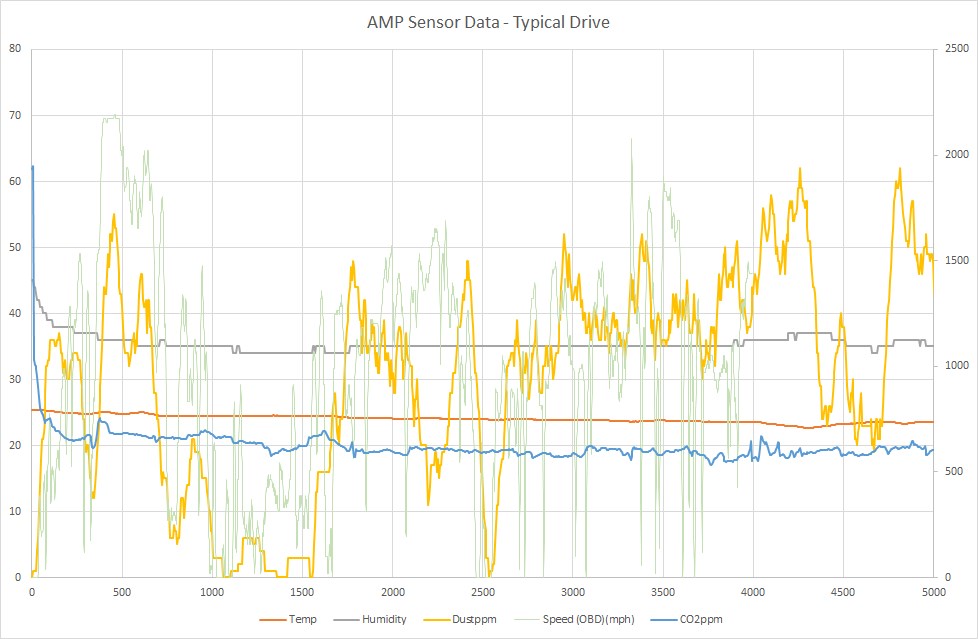
The graph above shows a typical drive cycle, short town traffic followed by highway (60 to 70 mph) for 40 minutes. An initial look suggests that dust level (yellow line) is proportional to speed (green line). But further analysis suggests that the other vehicles on the road at the time have a bigger influence. For example, if I follow a couple of lorries, then the dust level is far higher than if I am on an empty highway. I put this down more to up-draft of dust from the road surface than vehicle emissions.
The data also shows the operation of the climate control system. The difference can be easily seen when compared to a baseline measurement. For example, the initial pull-down of the cabin humidity is clear in the grey line. And the consistent cabin temperature can be seen in the orange line, despite the warm sunny outside conditions.
Extremes of data in the cabin of a car
Not all of the measurements were so positive in terms of the way the car was working. The climate system was great at managing the cabin temperature and humidity levels. But it was hiding something I didn’t expect.
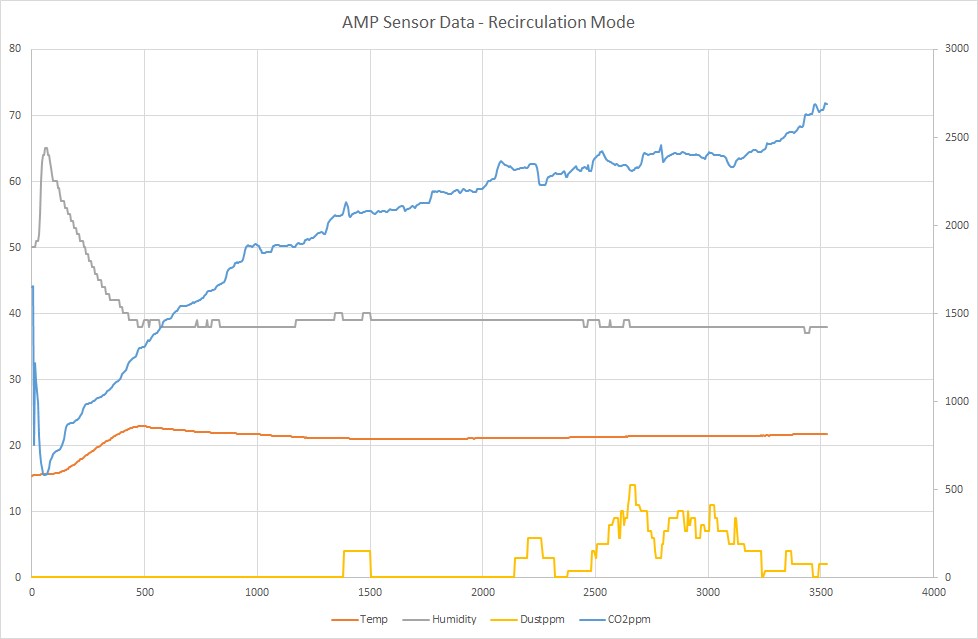
One of the most interesting measurements I made was to drive the car with the climate system locked in recirculation mode. This means the air in the cabin is not replaced with outside air, and the results are predictable if not worrying. With a giant CO2 generator in the cabin and no air exchange, the CO2ppm quickly climbs.
The scary bit is how fast it climbs and the effect it might be having on the driver. Kane International provide an interesting analysis table on their website. It highlights the impact of CO2 ppm on the human system. At 1000ppm, complaints of drowsiness occur. At 2000ppm, headaches, poor concentration and lack of attention all start to occur. None of these is great for a driver. At 2500ppm, I could notice some of these effects and had to stop the drive!
A great learning experience
I’ve only scratched the surface of the insights the kit give. The complete and in-depth article can be found on the Element14 website. I’m so glad I got the opportunity to try this kit. It’s been a real eye-opener and useful in my day job. I was allowed to keep the kit after the trial, and I keep using it!
This kit has stayed whole, unlike most of my Arduino projects that get pulled apart after a few months. Now and again, it comes back out to make some real-world measurements, then back in its box. For me, this is one of the most useful diagnostic tools I have lying around!
In the future, I hope to add a few more sensors to the kit. I already have the VOC sensor that Amphenol offers from the same range. One of the biggest opportunities for the system is to understand the difference between the inside and outside conditions. For example, using another sensor board hooked up to the Arduino could show how much dust is being filtered.
I’ll keep playing with the kit, and perhaps update this article if I discover something new.
M